
IELTS Writing Task 1: Table (Band 9 Sample Answer)
This Academic Task 1 pairs a bar chart with a table, so a band-9 response must integrate both sources. The model paraphrases the data, gives an overview of the biggest earners and movers, then reports the export values and the percentage changes in two organised paragraphs. It is about 180 words.
Get your own IELTS essay graded by AI
Band scores on all four criteria, line-by-line corrections and a model rewrite — free to start.
1The task
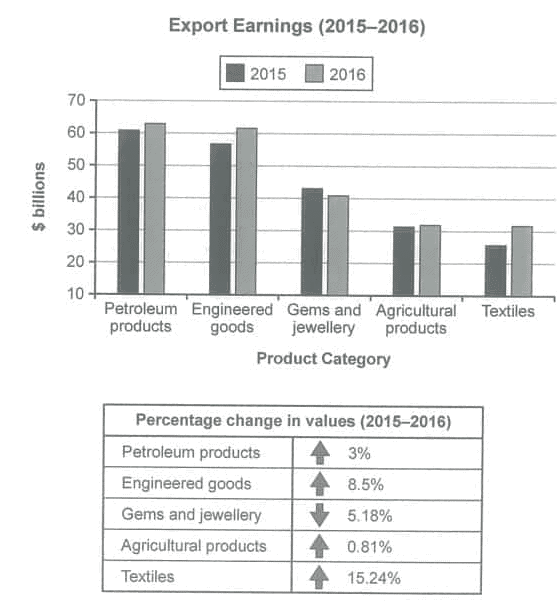
The chart below shows the value of one country’s exports in various categories during 2015 and 2016. The table shows the percentage change in each category of exports in 2016 compared with 2015. Summarise the information by selecting and reporting the main features and make comparisons where relevant.
2Band 9 sample answer
178 words · Band 9The bar chart shows how much a country earned from five categories of exports in 2015 and 2016, measured in billions of dollars, while the accompanying table gives the percentage change in each category between the two years.
1Overview
Overall, most categories earned more in 2016 than in 2015. Petroleum products were comfortably the largest source of income in both years, whereas textiles grew fastest in percentage terms and gems and jewellery was the only category whose earnings fell.
2Key features
In terms of value, petroleum products dominated, earning around $61 billion in 2015 and rising to roughly $63 billion in 2016. Engineered goods came next, climbing from about $57 to $61 billion. Gems and jewellery, agricultural products and textiles each earned considerably less, all below $45 billion.
The table reveals how sharply these figures moved. Textiles recorded by far the steepest rise, at 15.24%, despite remaining one of the smaller earners, followed by engineered goods on 8.5%. Petroleum and agricultural products edged up only marginally, by 3% and 0.81% respectively, and gems and jewellery was alone in declining, by 5.18%.
3Why this scores Band 9
1Task Achievement
Both sources are integrated — the chart’s values and the table’s percentages are reported and connected (e.g. textiles being a small earner yet the fastest riser). The overview captures the biggest earner and the key mover without listing every figure, exactly as band 9 requires.
2Coherence & Cohesion
The two body paragraphs are logically split — absolute values first, then percentage changes — and linked with clear signposting ("In terms of value", "The table reveals", "followed by", "alone in declining"). Nothing reads as a mechanical list.
3Lexical Resource
Precise, varied trend and quantity language — "comfortably the largest", "came next", "considerably less", "the steepest rise", "edged up only marginally" — with accurate approximation ("around", "roughly", "about"). Register is natural throughout.
4Grammatical Range & Accuracy
Structures are varied and controlled: a "while" contrast clause, comparatives and superlatives, "respectively" to pair values accurately, and a participial "climbing from … to …". The report is error-free without forced complexity.
4Useful collocations for this task
Tap a phrase to see what it means and how to use it. Natural collocations like these lift your Lexical Resource score.
5Frequently asked questions
How do I handle a chart AND a table together?
Integrate them. Report the values from the chart, then use the table to explain how those values changed — and, where possible, connect the two (e.g. a small earner with the biggest percentage rise). Ignoring one source caps Task Achievement.
Should percentages and dollar amounts go in separate paragraphs?
Usually yes — one body paragraph for the absolute values, one for the percentage changes — as this model does. It keeps each idea grouped and the report easy to follow.
How long should Academic Task 1 be?
At least 150 words in about 20 minutes; a band-9 answer is typically 170–200 words. This model is 178 words.
Can I copy the exact percentages from the table?
Yes — quoting figures like "15.24%" is accurate reporting. Just select the significant ones (the biggest riser, the only faller) rather than reciting every row.
Want feedback on your own answer?
Toey grades your essay on Task, Coherence, Lexical Resource and Grammar, then shows exactly how to reach the next band — free to start.
Try the free IELTS Writing grader